
Our Research Methodology: How We Build Reliable Market Intelligence
1. Defining Research Scope & Objectives
The first step in any high-value market study is clear research scoping. We begin by specifying the:
- Market segments to be analyzed (e.g., product types, applications, end-use industries)
- Geographic regions and time periods for forecast and historical analysis
- Business questions the report must answer (growth drivers, trends, competitive landscape)
This forms the foundation for structuring data collection, segmentation design, and analytical models that follow.
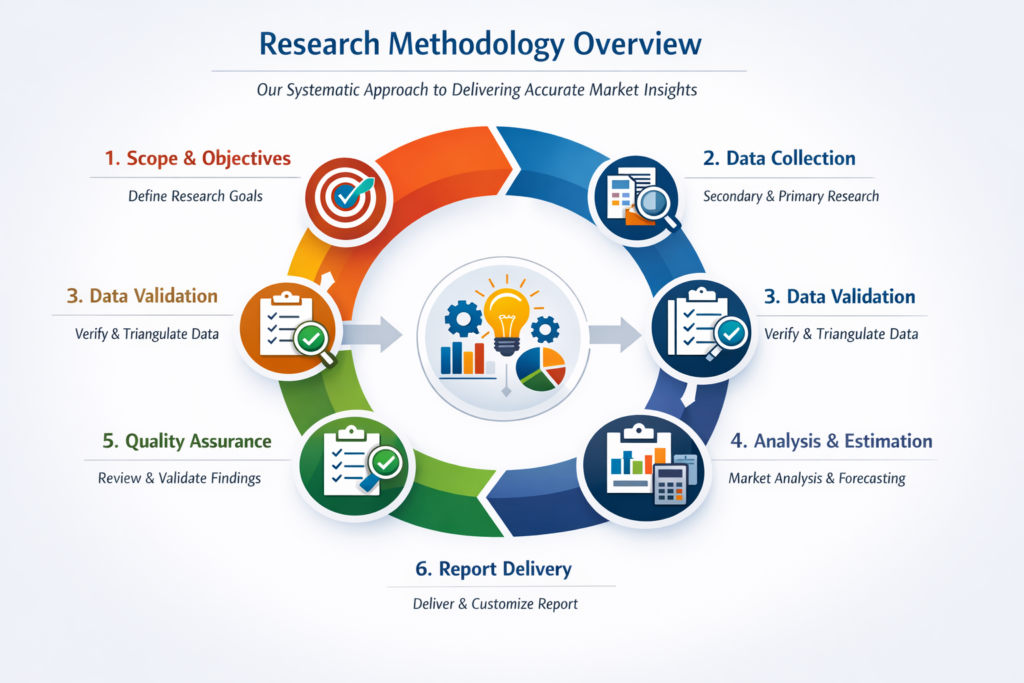
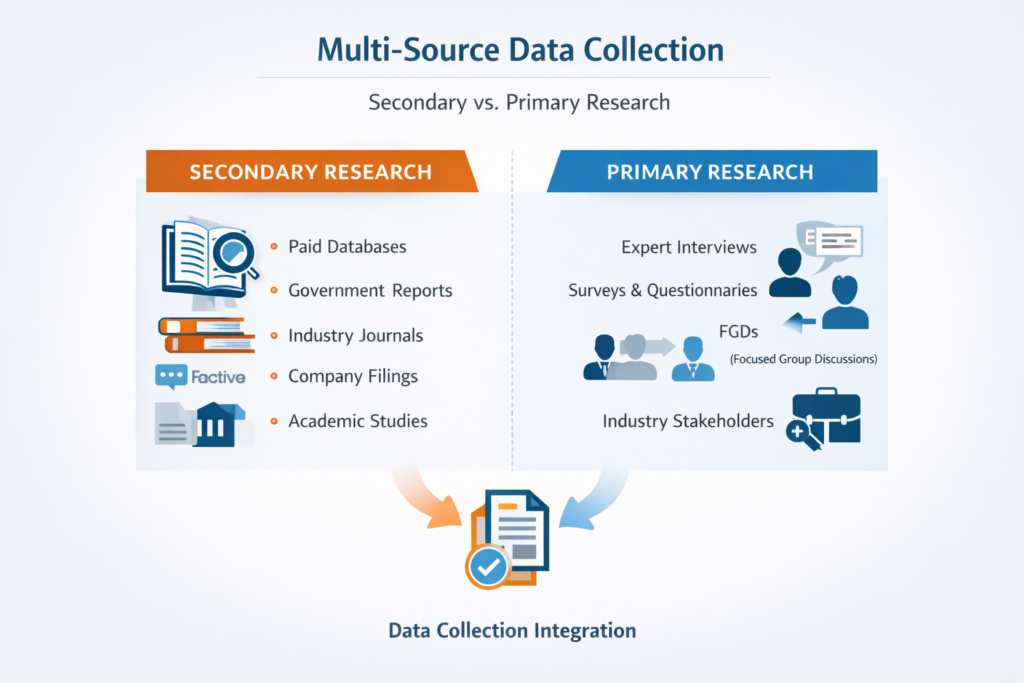
2. Multi-Channel Data Collection
Accurate insights start with reliable data. Our reports use a multi-layered data collection strategy:
A. Secondary (Desk) Research
We gather data from robust external databases and publications:
- Paid sources: Factiva, Hoover’s, industry journals
- Government and regulatory data
- Company filings, investor presentations, white papers
- NGO, trade association statistics and academic research
This ensures a broad and validated starting dataset.
B. Primary Research
Primary research strengthens accuracy through firsthand input:
- Expert interviews with industry stakeholders – executives, consultants, and subject matter experts
- Structured questionnaires and surveys with buyers, manufacturers, and technical specialists
- Focused group discussions (FGDs) to refine interpretation
Primary interactions are critically reviewed to reduce bias while deepening insight into market dynamics.
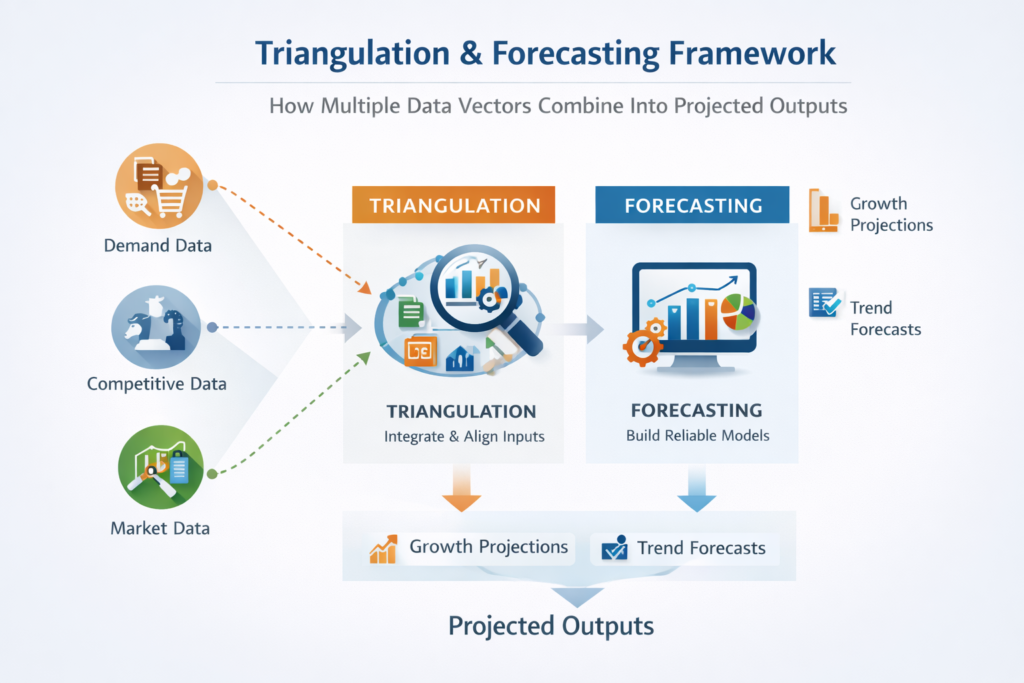
3. Data Validation & Triangulation
Data Bank Verification
We cross-check secondary and primary data against existing internal and public datasets on key variables such as:
- Revenue figures
- Market penetration levels
- Competitive activity
- Growth signals across segments
This automated and manual reconciliation ensures consistency and reliability before analysis.
Triangulation of Insights
Where several independent data points exist for a variable (e.g., demand figures, price trends), we compare and align them to establish:
- Consistent baselines
- Range estimates
- Best-fit forecasting inputs
Triangulation reduces dependence on any single source and strengthens confidence in outputs.
4. Analytical Framework & Estimation
After validation, we apply robust analytical frameworks to interpret and model the data:
A. Forecasting Approaches
We use a mix of modeling techniques:
- Bottom-Up Estimation – summing segment level demand across categories
- Top-Down Projection – evaluating total market potential and refining with adoption curves
- Combined Models – integrating both methods for complex product or multi-region markets
These approaches help produce reliable forecasts and growth estimates.
B. Value-Chain & Segment Analysis
Market sizing is supported by both:
- Supply-side evaluation – revenue share analysis, product flows
- Demand-side evaluation – end-user adoption trends and usage penetration
Applying both perspectives ensures comprehensive interpretation of market forces.
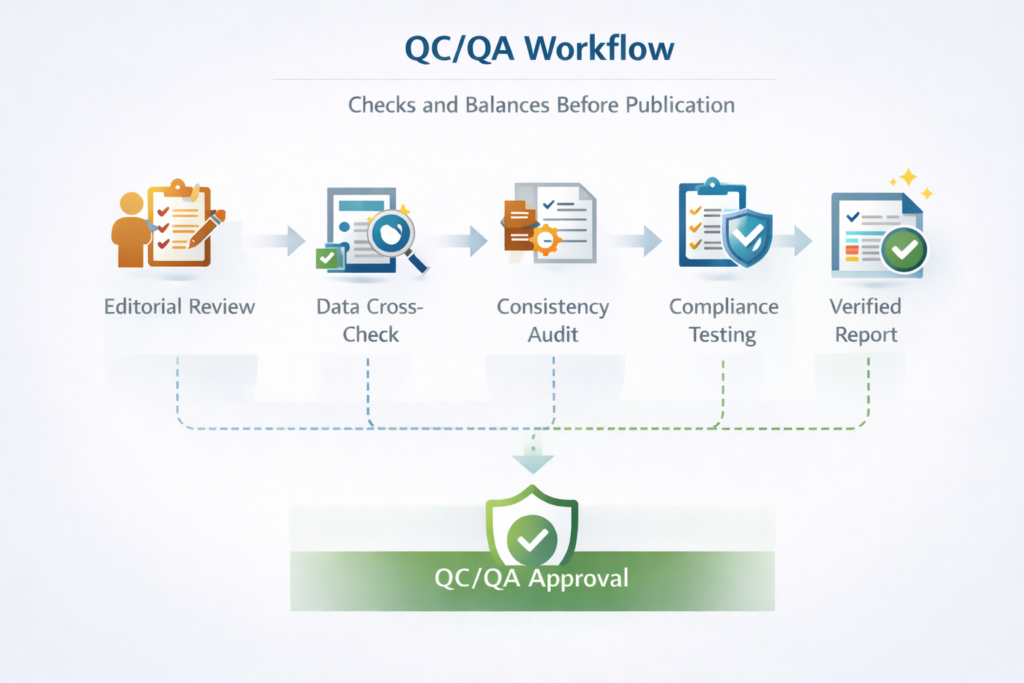
5. Quality Control & Quality Assurance (QC/QA)
Before any findings are finalized, our QC process includes:
- Editorial review by industry analysts
- Cross-review of numeric tables and visual data
- Consistency checks between narrative and figures
- Compliance testing vs. scope and objectives
This final stage ensures the published content is free of error and ready for strategic decisions.
6. Report Delivery & Customization Support
We deliver market insights in a format optimized for executive use:
- Clear segmentation charts
- Forecast models with transparent assumptions
- Competitive landscape profiling
Additionally, clients can request customization to adjust region, timeframe, or segmentation focus – ensuring the methodology can adapt to specific business needs.